Banking Overweight
Sector Outlook
- Stronger loan growth in 2018, slowing in 2019F
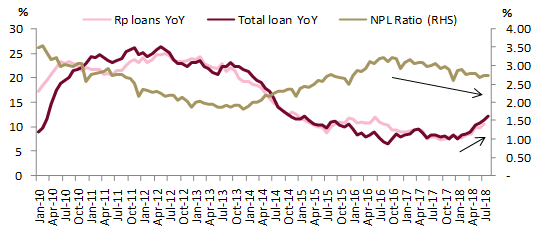
Loan growth accelerated in 2018 to 12.1% YoY as of Aug-18, up from 8.3% YoY as of Aug-17. Better loan demand has been seen especially in corporate loan segment, where many of big banks focus onthe segment as it offers better credit risk compared to middle loan segment. Along with better economy and better consumption, trade sector - the largest contributor to total loan - also rebounded to 10% YoY from the bottom of only 3% YoY growth in Sep-17. Similar with 2017, infra (23.4% YoY) and mortgage (14% YoY) also contribute to better loan growth in 2018F. All of this also was supported with a healthy bank’s balance sheet as they have recovered from bad credit cycle. Non-performing loan (NPL) steadily reduced since the peak at 3.22% of total loan asof Sep-16 to 2.7% as of Aug-18. However, as banks start to gradually increase the lending interest rates this quarter onwards, we see loan growth will become lower in 2019F at 9% YoY.
Exhibit 26: Loan growth accelerated along with improvement in NPL
Source: OJK and Ciptadana Sekuritas
- Liquidity in the banking system is tightening; but there is plenty of non-lending earnings asset in the book
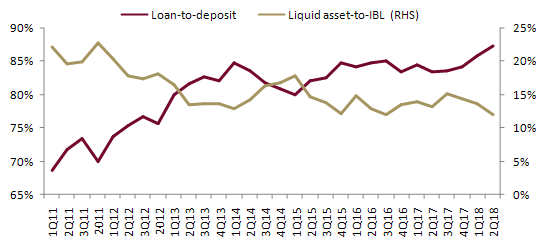
Lending growth is likely to surpass the deposit growth in 2018F, as deposit growth could only touched 6% YoY as of Aug-18. This condition brought loan-to-deposit ratio (LDR) to climb up to 88% on banks under our coverage, while the industry figure even arrive at higher level of 95% as of 2Q18. Hence we expect banks to continue to rise the time deposit pricing to attract more funding in 2019F, which makes net interest margin (NIM) to stay being under pressure in 2019F. However, we see banks will still focus on loan growth hence LDR is likely to move toward higher level until 2019F. We think the relief on liquidity would come from other sources such as: 1) Banks still accumulate non-lending earnings asset (such as placement in BI and marketable securities) at 23% of total earnings asset as of1H18, hence bank still have liquid assets to be converted to lending 2) The level of wholesale funding is still relatively low at<10% of total interest bearing liabilities (IBL), except for BBTN at 17% of total IBL.
Exhibit 27: LDR and liquid asset ratio on banks under our coverage
Source: Companies and Ciptadana Sekuritas
- Big banks more defensive against rate hike
Although the industry NIM is compressed, big banks should still perform better compared to industry average. In 2018, big banks were the first movers to make time deposit rates adjustment, hence it enabled the bank to attract customer deposits in the first place and a lower-NIM base effect to go to 2019F. Big bank such as BBCA has begun to increase the rates by 100 bps gradually in 1Q-3Q18, while other big SOE banks followed the step in 2Q-3Q18. Although have been aggressively adjust the time deposit pricing, the effect on bottom line is manageable as time deposit does not dominate the big banks’ book. Certain smaller banks, such as BBTN would also have better protection again NIM pressure as sizeable portion of their lending is linked to floating benchmark rate. Hence the hit on NIM on BBTN would be far more benign compared to 2014. With that said, we see the NIM pressure next year for most banks under our coverage would be limited (see exhibit 28). Given that the increase of 7DRR has been very aggressive this year, we see the possibility of similar hike in 2019F is rather limited. We expect 50 bps 7DRR increases in 2019F to 6.75% at the year end. We believe a cleaner rate trajectory in 2019F would become a positive catalyst as investors would not need to revise down earnings estimates.
Exhibit 28: Banks NIM trends
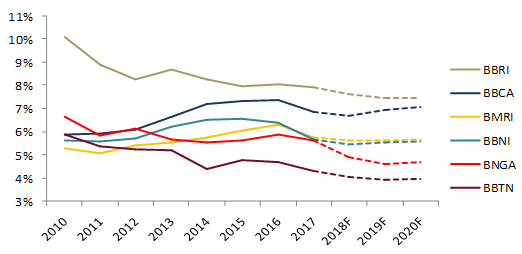
Source: Companies and Ciptadana Sekuritas
- Banks have conservatively charge provision in the last two years
During the period of 2017-2018, banking industry secured a higher loan loss reserve level with provision coverage increase to 118% as of Jul-18 from 102% as of Jul-16. For seven banks under our coverage, the coverage is even higher at 146% as of Jun-18, up from 126% as of Jun-16.We think this is good for the banking system as banks was going more conservative and also as the anticipation of new implementation of IFRS 9. Given that the banks also have been conservative in term of lending expansion in the last couple of years, we think the risk of dramatic increase in cost of credit is minimal for 2019F.
Exhibit 29: Provision coverage in banking industry
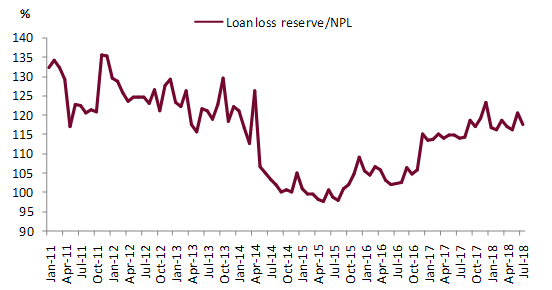
Source: OJK and Ciptadana Sekuritas
- Earnings growth is slowing
At the top-line until the pre-provisioning operating profit level, we expect single digit growth for the sector. Declining NIM estimates are the main reason we expect top-line to be only mid-single digit, but pre-provisioning operating profit should arrive at high single digit due to strong cost control. Below the pre-provisioning operating profit line, we expect benign increase in provisioning expense, hence bottom line in would able to touch double digit in 2019F for banks under our coverage.
For 2019F, we project banks net profit for our coverage to grow by 12.5% YoY, a further slowdown from 14.8% YoY in 1H18 and down from a high of 21.8% in 2017.
Exhibit 30: Earnings growth YoY for seven banks under our coverage
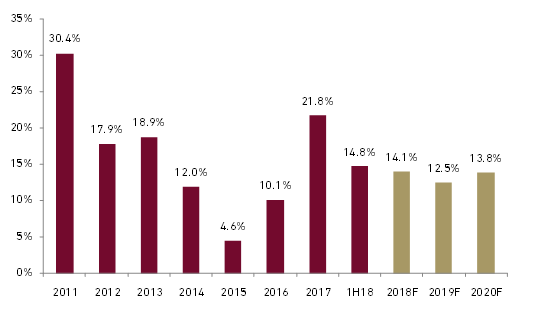
Source: Companies and Ciptadana Sekuritas
- Banking underperformed the market in 2018; attractive valuation
Banking sector saw heavy correction in 2018 mainly due to higher-than-expected hike in policy rates along with higher bond yield. Big four banks was down by 7% Ytd, underperforming the JCI by 1% as of Sep-18, and trades at 2.4x 2018F PBV or at the historical average. Although earnings growth is slowing, we think the bank stocks is cheap at the moment and offers a good entry point.
Exhibit 31: JAKFIN and big four banks under/over-performance compared to JCI
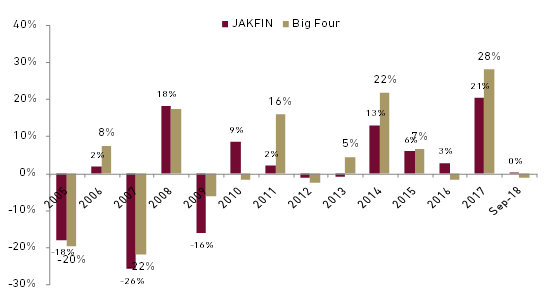
Source: Bloomberg, Bank Indonesia
We also think the situation will not be far different from 2014 in which banking sector outperformed the market by double digits. We see that in 2014 banking earnings were slowing as well (exhibit 30) mainly attributable to NIM pressure and slowing loan growth. However during the year of 2014 banking sector could still deliver major PE expansion after the trajectory of policy rates became clearer.
Exhibit 32: Big four banks valuations vs. monetary rates
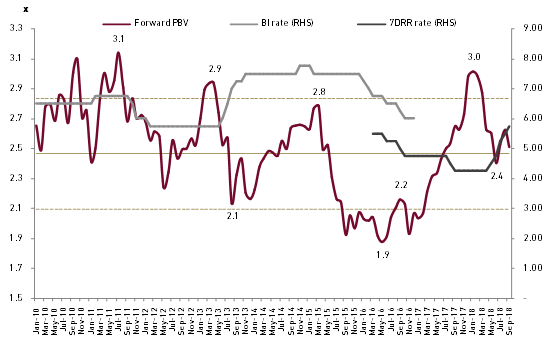
Source: Bloomberg, Bank Indonesia
Our order of preference for the big four banks are: BBNI, BBRI, BBCA, and BMRI. We believe BBRI to continue having strong loan growth from its subsidized micro and better upside from reduction of credit charge as they have became very conservative in the last two years. BBNI is still the cheapest bank among the big four and underperformed the most in 2018, but we expect it to perform well under rising interest rates environment and deliver double digit earnings growth potential. We also continue to like BTPS for the non-big four scope. We think the bank superior profitability is still under-appreciated by market. In addition, we also see many of the banks to have decent dividend yield. The big SOE banks such as BBRI, BMRI and BBNI have dividend yield potential of >3% in 2019F. Meanwhile BTPS would also start to pay dividend in 2020F at up to 40% payout ratio that would translate to 3.7% yield. Capital is not a big issue for banking industry at the moment as banks have been conservative in lending expansion and industry capital adequacy (CAR) steadily stands at 22.5% as of Jul-18.
Downside risks are higher than expected increase in policy rates and increase in bond yield, which could put NIM under more pressure and slowing the loan growth further. Worsening asset quality from longer-than-expected weaknesses in currency or slowing economy also became a key risk.
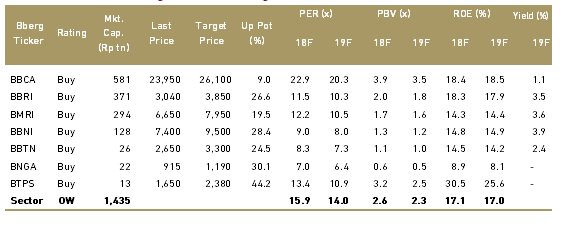
Exhibit 33: Banking sectors rating and valuation