Banking Overweight
Sector Outlook
- Solid earnings growth in 2023F
Banks under our coverage should perform really well in 2022F with earnings grew 33% YoY. This resilient performance was supported by high NIMs, picked up in loan growth, and cost efficiency. While Cost of Credit, despite has been significantly lower in 2022F compared to early times of pandemic, still stood at far higher level compared to pre-pandemic. This will provide an upside for earnings in 2023F as the CoC should move closer to their normal level. We expect the year of 2023F will continue to have resilient NIM while loan growth stable at double digit. We are expecting 12% YoY earnings growth for 2023F or still comfortably sit above the 3-years 2019-2022F CAGR.
Exhibit 26: Earnings growth for banks under our coverage
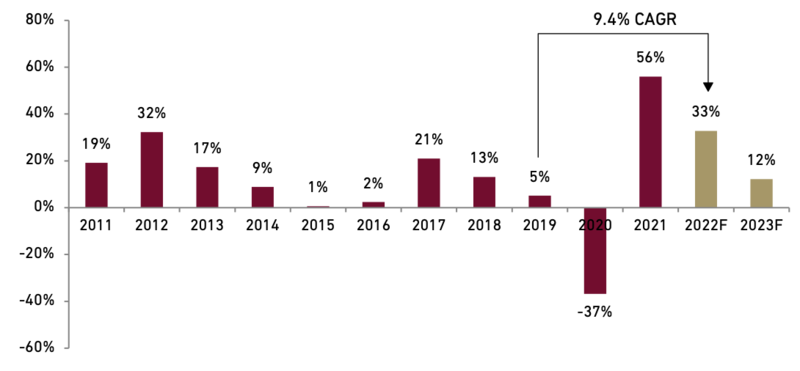
Source : Companies and Ciptadana
- Banks were underperforming JCI in 2022 weighed by digital, while big four marginally outperformed
Despite the solid earnings performance in 2022F, banks as represented by IDXFINANCE were underperforming JCI by -10% YtD (as of Aug-22). We think this is on the back of deep correction in digital banks (ARTO, BBYB, BANK, BBHI, AGRO), which underperformed JCI by -57% YtD (equal-weighted). Meanwhile the big four banks were outperforming JCI by a very narrow margin of 4% YtD, following a marginal outperforming of 2% in 2021 and an underperforming of -1% in 2020.
Considering those marginal outperformances in the past two years, we see the big four banks is set to outperform JCI in 2023F. We believe the solid earnings recovery in 2021-22F along with satisfying earnings growth in 2023F will result in compelling upside for banking stocks. We also expect the digital banks to perform well following its deep correction in 2022.
Exhibit 27: Banking sector performance relative to JCI
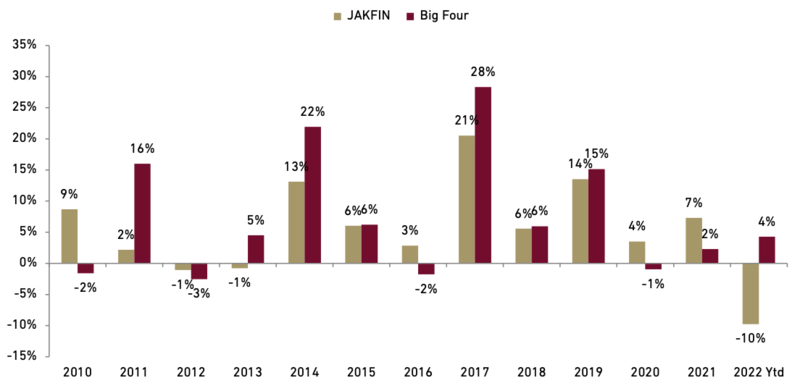
Source : Bloomberg and Ciptadana
- Stable loan growth in 2023F
We believe the main two sectors in Indonesia banking system (trading and manufacturing) will perform well following the gradual recovery in consumption. Other sector such as commodity will also perform well for couple of years post the super commodity cycle. This is as Indonesia benefit from soaring commodity prices being one of the largest exporters of palm oil and coal and a major metals producer. While the laggards on loan growth will come from infrastructure-related sector, continuing the trends during pandemic and weakening budgets. Mortgage loan growth will slightly weaken due rising interest rates; however, it will partially offset by better loan demand post economic recovery and better housing prices.
Exhibit 28: Loan exposure on Indonesia banking system
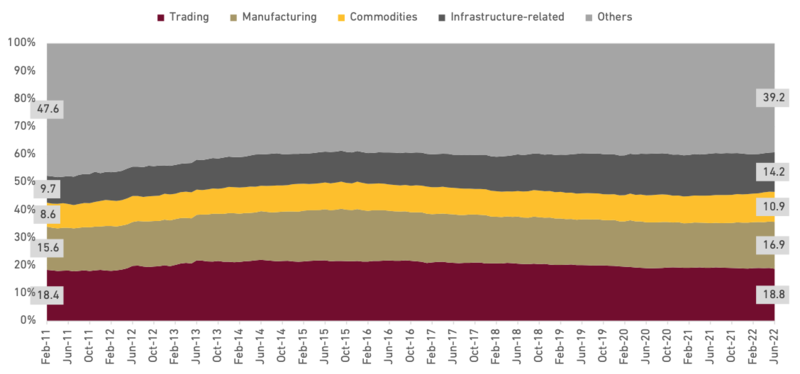
Source : OJK and Ciptadana
In terms of loan market share, big banks will continue to take more market share as they secure more loan growth on more competitive loan pricing. Hence we expect a higher loan growth for banks under our coverage compared to the banking system overall. Corporate loan segment will continue to be the big target market for the big banks, while medium-commercial segment will not be chased to much considering the economic uncertainty. Micro loan growth will continue to be aggressive in 2023F, driven by increasing target of subsidized micro (KUR) loan. Overall we expect a stable loan growth of 10% for banking system for 2023F (vs. 10.6% as of Jun-22).
Exhibit 29: Loan vs. deposit growth trends
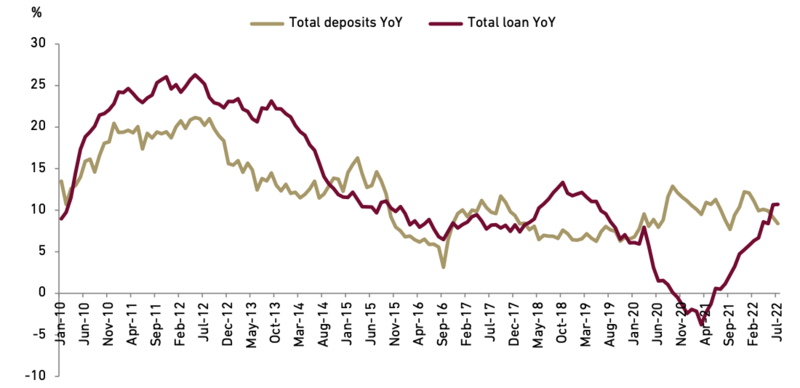
Source : OJK and Ciptadana
As loan growth is expected to outpace deposit growth, LDR will arguably track higher in 2023F. Big four banks LDR will go up faster than the non-big four in our view as they are gaining loan growth given their cheaper Cost of Funding.
Exhibit 30: Big four banks LDR creep up faster as they gaining loan growth
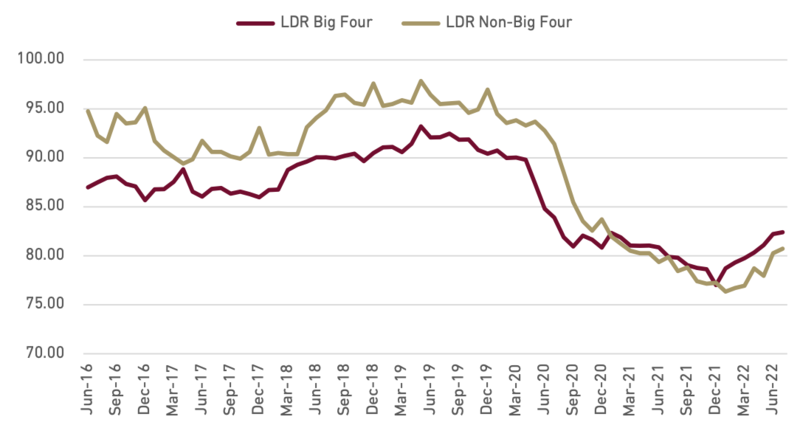
Source : Companies, BI, and Ciptadana
- Historically banking share prices are corrected during rate hike cycle
Banking industry also face the condition of tighter monetary policy marked with tighter liquidity (higher minimum reserve ratio, higher LDR) and increasing rates. Historically, rising rates were followed by periods of lower NIM as CoF tends to reprice faster (1-3 months) compared to the asset yield. Hence it is not surprising that banking sector shares historically are corrected during rate hikes as represented by the big four banks valuations (Exh. 31).
Exhibit 31: Rate hikes vs. big-4 banks forward PBV
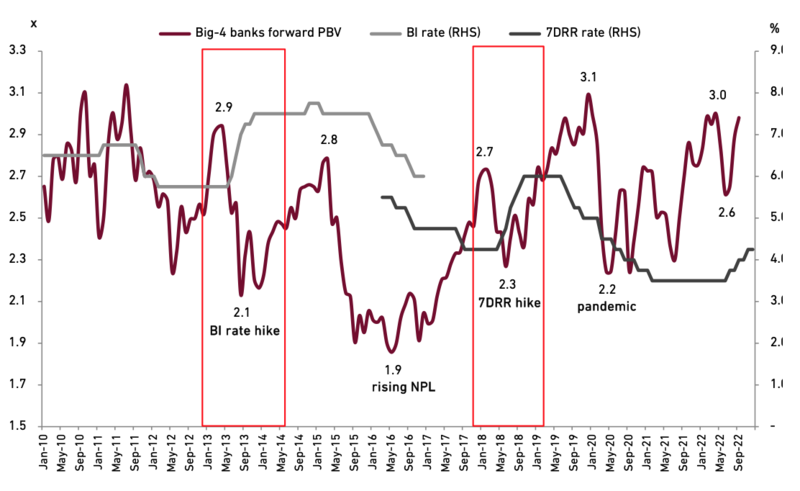
Source : BI, Bloomberg, and Ciptadana
- ...but this time, there is double buffer on liquidity
However, aside from LDR, banks also can use their holdings of liquid assets to help fund loans growth. Liquid assets as a percentage of total deposits (liquid asset ratio) on the system climbed to 35% as of 4Q21 from a low of 19% as of 2Q19, and only slightly declined to 30% as of 2Q22. Compared to LDR, liquid assets ratio is a better measure of liquidity in our view as it takes into account contribution of placements that is placed in SBI which should be much increased after pandemic due to the liquidity flush. The current level of liquid assets is still very much healthy in our view and should provide some buffer against pressure on funding.
Exhibit 32: LDR and liquid asset ratio in the system
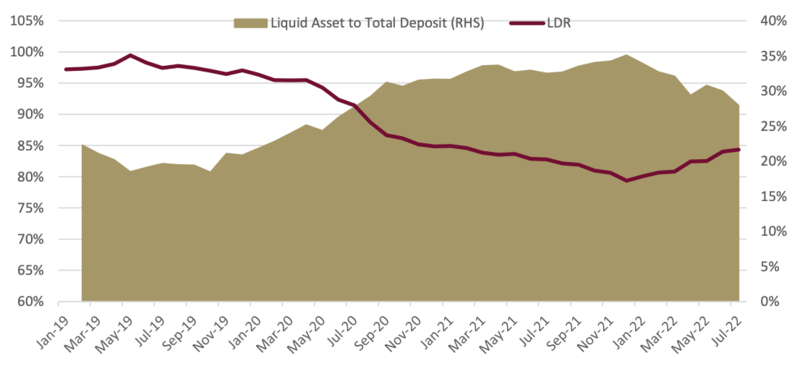
Source : BI and Ciptadana
With that said, we see that banking industry has secured a double buffer for liquidity as they have huge room for LDR maximization added by room from the liquid assets to sustain the loan growth. We believe our loan growth expectation of 10% YoY in 2023F would still result in system LDR tracking up not very far to 83% by 2023F (vs. 82% in 2Q22). We see this level of loan growth could be sustained without the needs to chasing third party fund or time deposit through higher rates.
We also see that LDR in rupiah currency still much ample compared to the LDR in foreign exchange. LDR in foreign exchange showed a much tightening trend. Coupled with higher rates, this could result in more difficult liquidity room and challenging the FX loan growth in our view.
Exhibit 33: LDR based on currency
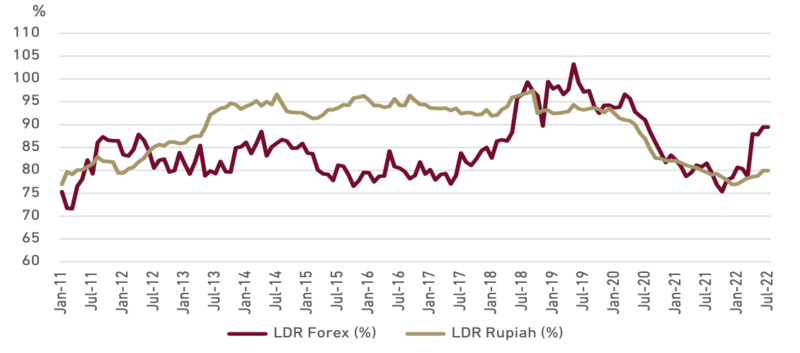
Source : OJK and Ciptadana
- Negative TD spread and its contribution to CASA ratio
Quick adjustment on Time deposit (TD) rates historically happen due to pressure in liquidity as the bank wants to chase third party funding. However, due to the liquidity flush during pandemic, banks’ TD rates reduced dramatically in 2020-21 resulting in 1-month TD rates to fell below the 7-days reverse repo rate or creating negative spread. This also resulted in a very narrow spread between the TD and CASA rates at only 220bps (vs. 500-700bps spread in previous rate hike cycles, see Exh. 35). We see this spread is quite narrow while banks have little incentives to widen the spread again.
This condition has encouraged shifting to CASA. Hence CASA ratio tends to improve along with decrease in TD rates, resulting in negative correlation between CASA ratio and TD rates. For 2023F, given this unaggressive deposit competition, we expect the rise in TD rates will be much slower compared to the past. If the adjustment in TD rates could take 1-3 months delay from BI rate changes in the past, we believe this time it could take 3 or longer months and the magnitude will be small. Therefore, we expect that CASA would stay ample at >60% for the banking system overall (vs. ~55% in pre-pandemic). This ample CASA will act as a buffer in CoF rise, in our view. However, the risk would lie if there is sharp rise in BI rates that will affect TD rates faster as CASA also will worsen faster.
Exhibit 34: Benchmark rate vs. TD rates
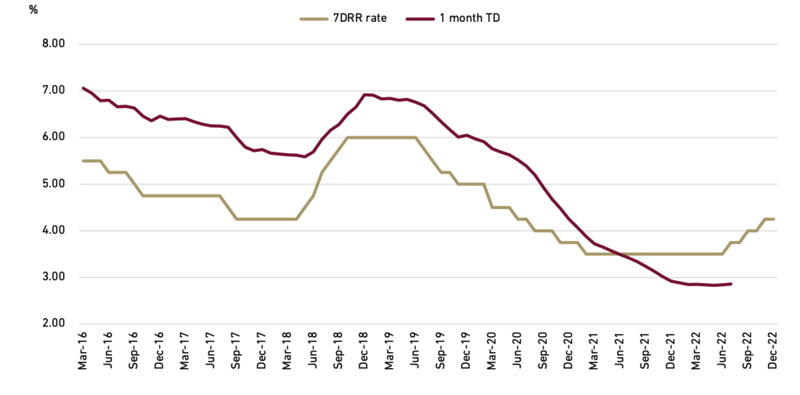
Source : BI and Ciptadana
Exhibit 35: TD rates spread and CASA ratio
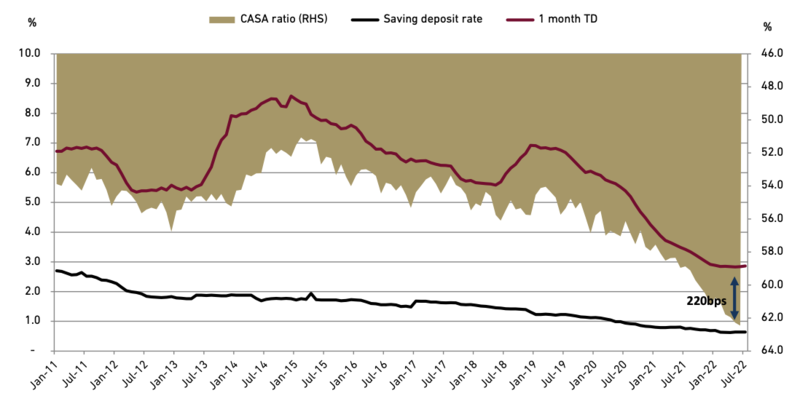
Source : Companies and Ciptadana
Exhibit 36: Cost of funding for banks under our coverage
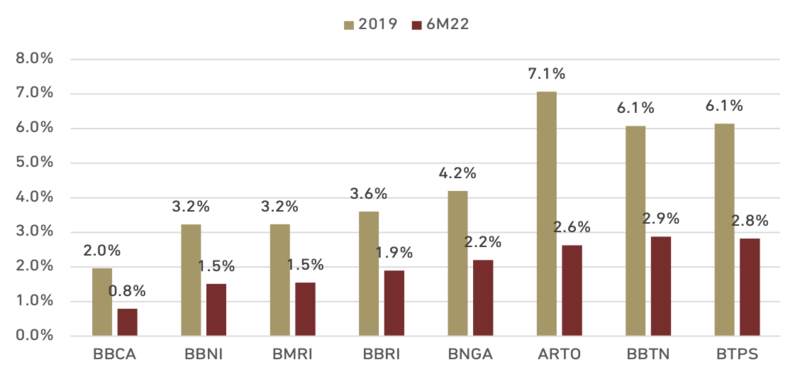
Source : Companies and Ciptadana
- Asset yield movement will depend on each bank’s exposure
We see the upward repricing for loan will be relatively slow as most of the bank will still focus on high quality-loan expansion post economic re-opening. Rates adjustment for consumer loan tends to take longer time to re-price in our view, as it is more sensitive to NPL. Rates adjustment for retail customer is also relatively slower, as high-quality loan would be the main focus in this segment. While the smaller retail segment such as micro and ultra-micro would be insensitive to rate changes, but yield adjustment in this segment is unlikely as it mostly set by the government.
However, the banks that holds large amount of variable rates that is adjusted automatically following the market, should benefit in this condition of higher interest rate. This is usually the loan to wholesale segment. We see that BBNI and BMRI holds the largest contribution, followed by BBCA, hence will be benefit from the rate hike cycle.
Small help to loan yield will also come from much decreasing restructured loan, as the continued relaxation and restructuring will only continue for certain sector only in 2023F.
Exhibit 37: NIM vs. benchmark rate
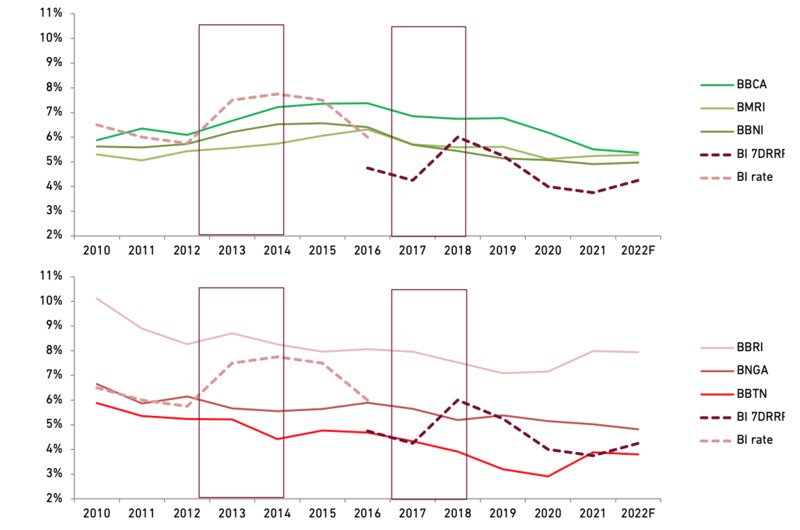
Source : Companies, BI, and Ciptadana Sekuritas Asia
- Hence, NIM will be much more defensive than previous rate hike cycle
Overall, NIM for overall banking system will be much more defensive than previous rate hike cycle. System NIM would slightly trend lower in 2023F due to TD rate adjustment in the late year. NII growth will still robust as it is helped by better loan growth. Meanwhile for banks under our coverage, NIM should improve further in 2023F. We expect further NIM improvement for BBCA, BBNI, and BMRI in 2023F, while slight NIM contraction for BBRI, BNGA, and BBTN. We also expect BTPS to have solid NIM on normalizing restructuring and much declining delayed payment, while ARTO to continue its mid-teens NIM with more optimal loan mix on its balance sheet.
- Relatively resilient asset quality despite challenges
We believe the NPL to be relatively resilient despite the global economic challenges as it supported from the domestic economy. NPL from the two largest sectors (trading and manufacturing, 36% of total loan and 56% of total NPL in the system as of 1H22) are negatively correlated with the economic growth. However, despite slower economic growth next year, we expect both trading and manufacturing NPL to remain robust supported by gradual recovery in consumption. Historical data also shows that commodity sector would experience worsening asset quality on the time of economic recession. But we see that this is not the case this time as Indonesia is helped by super commodity cycle.
In terms of loan segmentation, we see loan on medium segment continue to have largest sensitivities to weaknesses in economy, followed by corporate segment. Micro loan segment has been relatively resilient throughout the economic cycle.
Exhibit 38: NPL trends based on segment on big three SOE banks
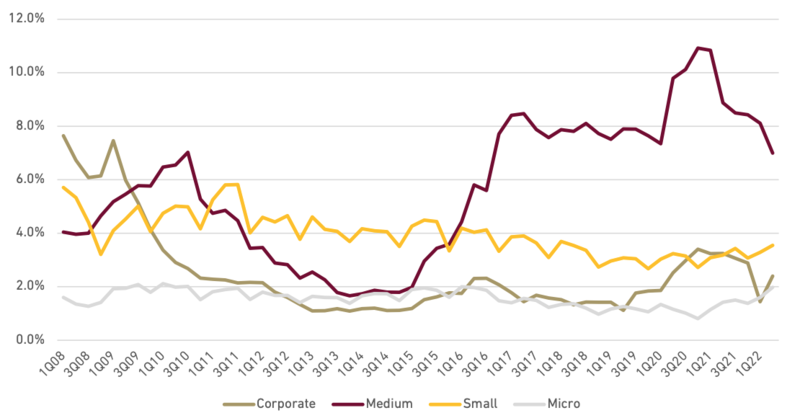
Source : Companies and Ciptadana
- Ample loan loss coverage, minimal concern on asset quality
With relatively limited challenge to NPL going forward, we believe the worst of asset quality cycle has been behind. Loan-at-risk (LAR) for banks under our coverage has been peaking at 25% as of 4Q20 and trended down to 17.5% as of 2Q22. The most significant improvement came from restructured current loan, which peaking at 17.6% of total loan in 4Q20 and down to 10.2% of total loan as of 2Q22. Loan loss coverage has achieved 7.4% of total loan for the big four banks. LAR coverage are almost doubled at 42% as of 2Q22 (vs. 25% in 2Q20). We believe most of the bank has prepared well on the end of relaxation in 1Q23. There is possibility that Financial Services Authority (OJK) will prolong the restructuring relaxation but specific to certain sector such as the transportation and accommodation sector, which still impacted by pandemic.
Exhibit 39: LAR for banks under our coverage
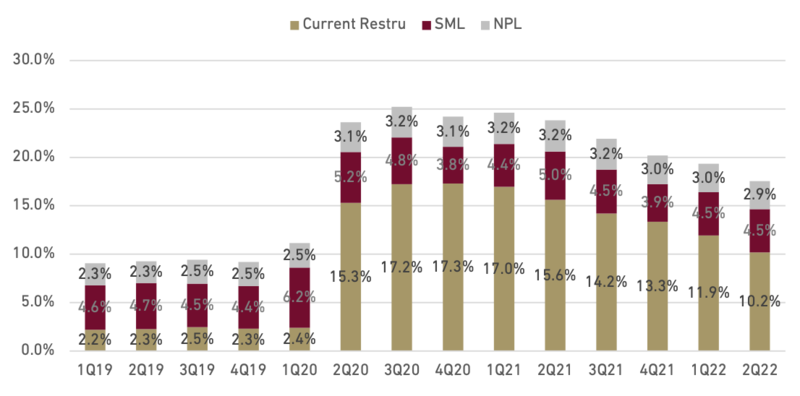
Source : Companies and Ciptadana
- BBNI and BBRI has seen most meaningful LAR coverage improvement
As for specific banks, BBCA holds the thickest LAR coverage as of 1H22 followed by BBRI, BBNI and BMRI although with a narrow margin compared to historical (see Exh. 40). This resulted from aggressive provisioning strategy that we see in BBNI and BBRI most specifically for the past couple of years. Meanwhile for the non-big four banks, the amount of LAR coverage is greatly varying as it is affected by their loan focus. However the level of coverage for non-big four banks mostly stood at lower level than the big-four. Almost all banks, including the small ones, have significantly thickened their coverage level compared to early times of pandemic (Exh. 40).
Exhibit 40: BBCA holds the thickest LAR coverage followed by BBRI, BBNI, and BMRI
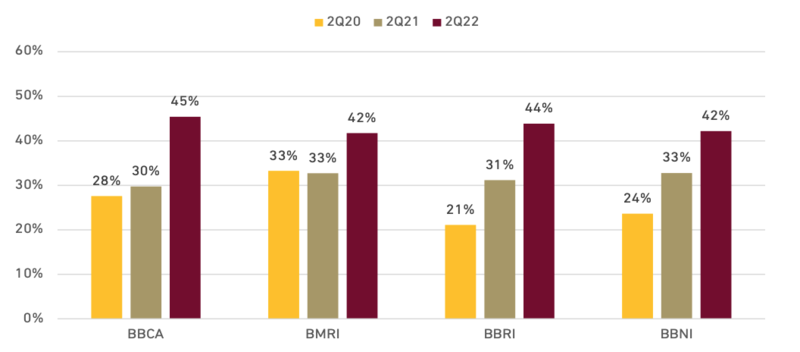
Source : Companies and Ciptadana
Exhibit 41: LAR coverage for non-big four banks
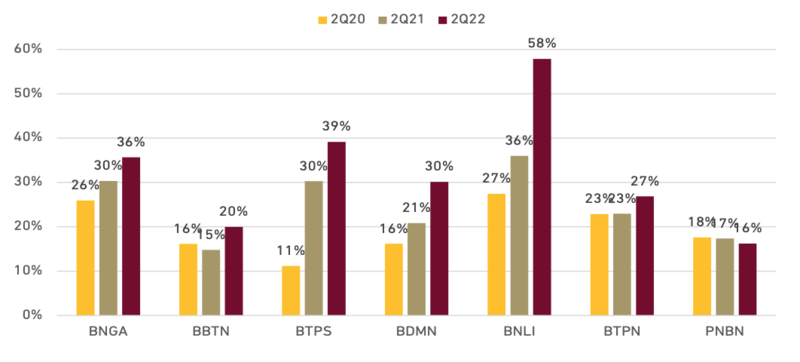
Source : OJK, companies, and Ciptadana
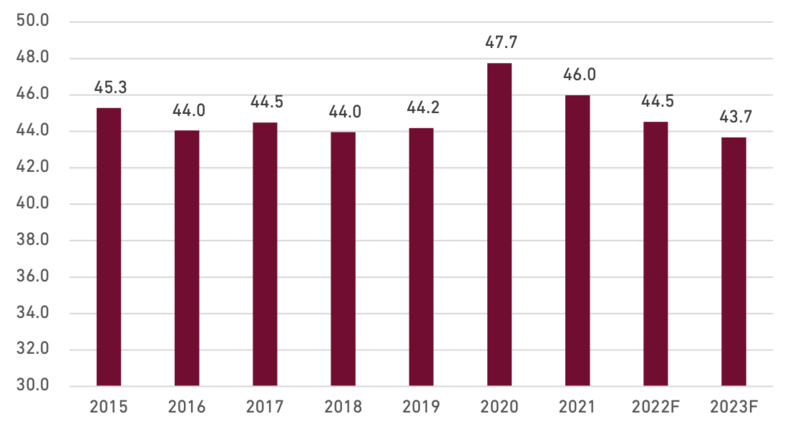
We see that cost-to-income ratio (CIR) is set to achieve the pre-pandemic level by 2023F at 43.7% (vs. the worst of 47.7% in 2020 and 44.0% before pandemic). Along with the robust growth in the revenue side (from both NII and non-interest income) and coupled with structural efficiency in most banks, we believe CIR is set to improve in the long term.
Exhibit 42: CIR is yet to improve to pre-pandemic level by 2023F
Source : Companies and Ciptadana
- Maintain Overweight for Indonesian Banking Sector, BBNI as our top pick
Valuations for the Indonesia banking sector is compelling in our view as there is price correction due to increasing rates and push from global economic factors. BBNI still has the most compelling valuation among the big banks while its ROE profile is trending up to mid-single digit. Strong transformation strategy in BBNI would result in better credit profile. Their strategy to focus on lower-yielding asset would negatively impact asset yield but we see faster lending rate adjustment in their focus segment (corporate) will mitigate some of the impact. Key risks for banking sector would come from weaker-than-expected economy and much sharper-than-expected rise in interest rate and inflation.
Exhibit 43: Forward PBV*
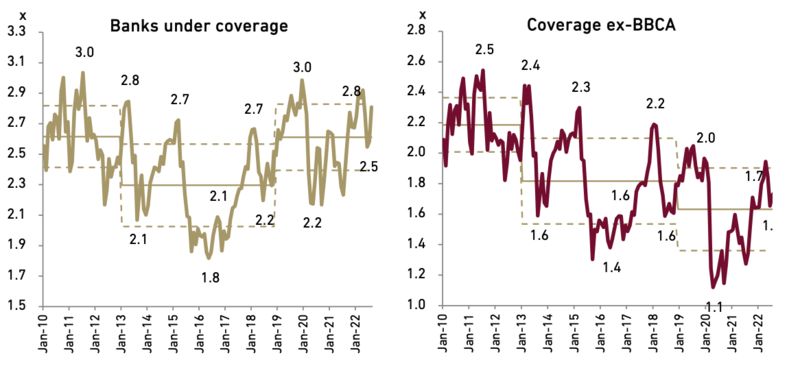
Source : Ciptadana *excluding ARTO due to scalability
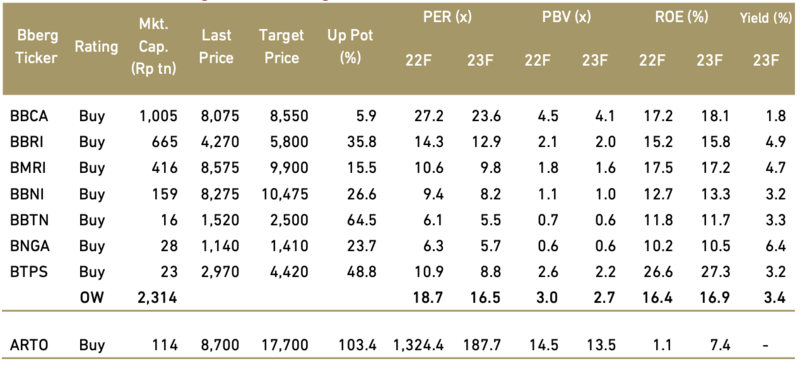
Exhibit 44: Banking stocks rating and valuation