Economic Outlook
Global economic: pressure to emerging market may ease
High volatility became the main theme of 2018 macroeconomic environment. There are 3 major events triggering volatility: shifting FFR hike expectation, US – China trade war and emerging market countries currency crises (esp. Turkish Lira, Argentine Peso, etc). In 2019, we predicted volatility will be lower, enabling bull sentiment to take over after full year of bearish trend in 2018. However, risks still remain from possibility of more than 50 bps FFR hike, US – China trade war effect on their and global growth, potential new trade war between US – Japan and potential debt crisis in Turkey.
- 50 bps FFR hike in 2019 has priced in, 75 bps not yet
In 1H18, bearish sentiment had started since there were FFR hike expectation shift. In the beginning of this year, we shifted our expectation to 100 bps (4 times) FFR hike and were confirmed by Fed’s projection plot in June’s meeting. At end of 2017, most of economist surveyed by Bloomberg was still dovish, predicting 50 bps (2 times) FFR hikes in 2018. However, the forecast shifted to 75 bps (3 times) hikes in the end of January and shifted again to 100 bps (4 times) in April. The first shift (January – February) made USD/Rupiah depreciate from around Rp13,400 to Rp13,700 while the second shift (April) made Rupiah depreciate from around Rp 13,700 to Rp 13,900. Currently, Bloomberg consensus has priced in with us and Fed’s dot pot at 100 bps hike in 2018
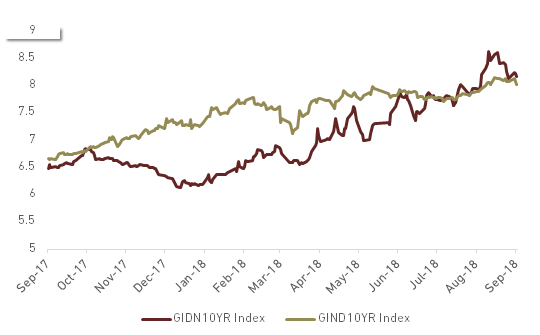
For 2019, we expect another 50 bps (2 times) FFR hike. Market seemed to price in 50 bps FFR hike since end of September 2018 (see exhibit 2) which make the 10 yr UST yield reached more than 3%. There is still a risk that FOMC will raise FFR by 75 bps (3 times) as their September projection still incorporate 3 hikes to 3.00% - 3.25%, slightly above 3% neutral rate. However, we see that US-China trade war effect may change employment trend in 2019 and prevent Fed to raise rate beyond neutral rate. If FFR is only raised by 50 bps next year, then current market expectation has priced in the hikes. If FFR raised more than 50 bps, we expect another expectation shift in 1Q19.
Exhibit 1: Bloomberg Economist Survey Estimate of 2019 FFR Hike
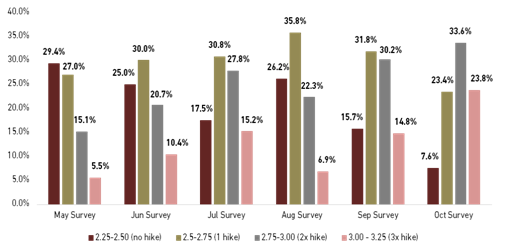
Source: Bloomberg
Exhibit 2: FOMC Participants View on Future Monetary Policy

Source: The Fed
- Trade war peak has passed but beware of its effect to growth
Trade war tension between US and China escalated significantly after they imposed tariff to each other products. As of October, US has sanctioned USD 250 bn of China’s goods with 10% - 25% tariff while China replied with imposing 25% tariff to USD110 bn of US goods. There is USD267 bn of China export products to US that not given tariff and there is a chance for Trump administration to enlarge trade war with Japan. However, we see that after November parliamentary election, the movement of Trump administration will be more limited as Democrats is predicted to take over the House.
Some risks though still need our further attention, such as:
- Potential Crisis in Italy, Turkey and some other emerging crisis
Political and debt turmoil had been major risk in Italy, 3rd biggest country in EU. As political condition became unstable due to popular anti EU in the election, Italy also faced problems with its high debt. Any crisis emerge from this country will significantly affect EU. Moreover, we also view potential debt crisis from Turkey as its Lira depreciated more than 40% in 2018. Most of Turkey’s debt is denominated outside Lira, making the debt is very vulnerable with the currency crisis. Other emerging market also had potential to crisis due to Fed’s policy normalization and domestic circumstances like Argentine, Venezuela and South Africa
- Surge of oil price
High commodity prices are not always good for Indonesia’s economy, especially for oil price as Indonesia is a net importer of oil. Currently, Brent oil price already breaks above USD 80/barrel level as the result of OPEC production cut, increasing global demand and US sanction to Iran. If both OPEC and US do not increase the output, more than USD 90/barrel will not be impossible to be reached. Rising oil price will give another pressure to Indonesia’s CAD and Rupiah.
Exhibit 3: Global Economic Growth Forecast
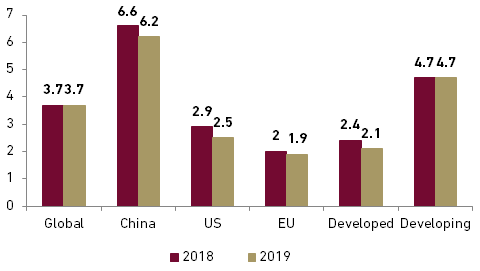
Source: IMF
Exhibit 4: Brent Oil, ICP and Pertamax Price
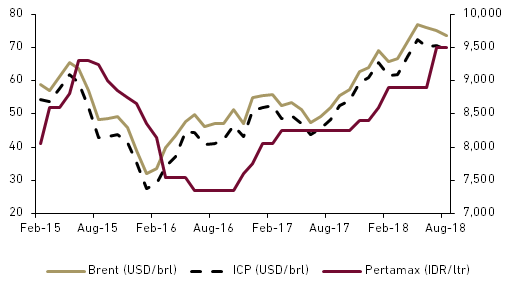
Source: Bloomberg
CAD to slightly lower but remains high
Contrary to 2017 condition, trade balance experienced significant deficit (USD -4.1 bn YTD as of Aug -18) and even make current account deficit (CAD) was at 3.04% or above 3% safe limit in 2Q18. Better GDP and domestic demand made import growth jumped 24.52% YoY, reaching USD 124.2 bn as of September 2018. Higher oil price in 2018 (2018 avg: USD 72.7/barrel (as of Sept) vs 2017 avg: USD 54.8/barrel) gave another pressure to trade performance as Indonesia has became net oil importer since the beginning of 21st century. Export growth was actually not that disappointing as it had 10.39% YoY growth, boosted by higher coal and oil price. However, it could not still compensate jump in import growth. Moreover, Indonesia’s export reliance to commodities as main source of growth made limit its expansion to movement in commodities price, especially coal and CPO.
- Awaiting government’s program to limit import’s result
Starting September, government initiate some policies to reduce Indonesia’s import burden: B20 to improve utilization of CPO and reduce oil import, increasing income tax for several imported goods and delaying some of infrastructure projects to hold capital import goods. Although we are not sure increasing income tax for several imported goods will be significant to reduce import, we believe implementing B20 policy and halting some of infrastructure projects will give better outcomes. Furthermore, we view that Rupiah depreciation itself that will help to reduce import next year. We expect real import to grow 7.4% YoY from 10.5% in 2018F.
- Limited boost from commodities price
We do not expect both coal and CPO price to become the main driver of export growth in 2019. Asia-Pacific coal benchmark Newcastle prices is expected to average USD98/ton in 2019, slightly lower from USD104/ton this year average. We also do not see any significant pick up on CPO price as our analyst expect Malaysian peninsular price to remain stable at MYR 2,400/ton. Real export growth will slightly decrease to 6.8% YoY in 2019F, down from 2018F at 7.5% YoY
- Trade deficit lower but CAD to remain high at 2.5% of GDP
Considering our previous assumptions, we expect trade balance to remain in deficit territory but with lower magnitude. Service trade balance may have lower deficit in 2019 as tourism performance keep improving. Assuming no significant changes from both primary income and secondary income figures, we expect CAD at 2.5% of GDP next year, slightly lower than 2018F at 2.8% of GDP.
Exhibit 5: Commodities Price Forecast (Annual Average)
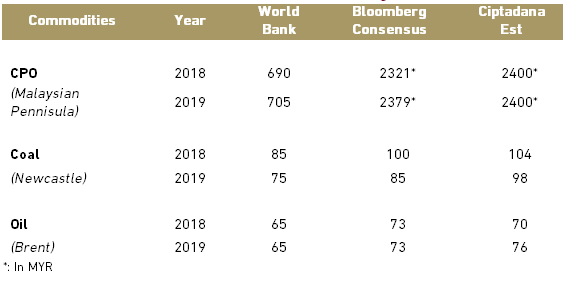
Source: WB, Bloomberg, Ciptadana Estimates
Inflation to remain stable at 3.5% despite potential fuel price hike
Inflation in 2018 remained low, even reaching 2.88% YoY in September 2018 and we expect YE 2018 inflation at 3.2% YoY. Thanks to less change in administered price and still manageable food price, Indonesia can keep its inflation low despite higher GDP growth. Although we expect subsidized fuel price hike in 2019, we remain confidence that 2019 inflation will still be manageable. Government will all out to maintain inflation, especially for food sector, in order to secure its position in upcoming election. Moreover, one of main theme from the opposition team is about relatively expensive food price for middle lower segment. High rice import in 2018 should help government secure inflation in 2019. Moreover, we see that higher interest rate may affect lower core inflation next year, in line with lower 2019F GDP growth.
- Fuel price can be raised in 2019
Government’ promise to maintain subsidized fuel price may end in 2019, especially after election period. We see that government try to hold price until next year for maintaining stability entering election period. Next year should be the correct time for subsidized fuel (Gasoline premium and Solar) price hike due to higher oil price. Current subsidized fuel price (Premium: Rp 6,500; Solar: Rp 5,500) was determined when Brent oil price was around 50/barrel (average 2019F: USD 76/barrel). Other fuel series had followed global oil price increase, like Pertalite (4.0%) and Pertamax (13.0%). We expect Rp 500/litre increase for both subsidized price (Premium: 7.6%; Solar: 9.7%) to make Pertamina’s balance sheet healthier.
- Limited impact of Rupiah depreciation
Rupiah depreciation is seen to have limited impact to core inflation. Unstable domestic demand recovery make most manufacture will only pass less significant amount of input cost to consumers. In 2013 and 2015, higher inflation was tend to be driven by subsidized fuel price hike as the inflation was already higher when Rupiah started to depreciate. Exhibit 7 denoted retailers’ preference to lower their margin as the higher wholesale inflation is not fully translated to higher consumer inflation. This situation makes us expect core inflation to be lower at 2.8% YoY, lower than our 2018F at 3.1% YoY. All in all, we expect inflation to remain at 3.5% YoY in 2019 despite fuel price hike.
Exhibit 6: YoY Inflation and policy rate
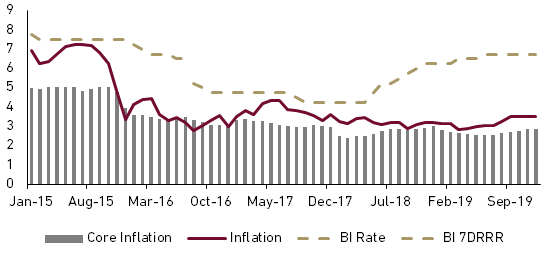
Source: CEIC, BI, Ciptadana Estimation
Exhibit 7: CPI Inflation and LWPI Inflation
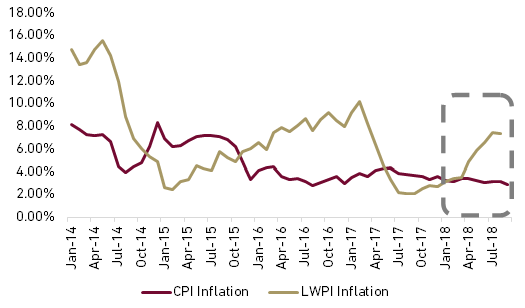
Source: CEIC
Rupiah pressure from CAD, expect 50 bps rate hike in our base case
Combination of global pressure and widening CAD led to significant pressure to Rupiah, making it depreciated around 10% YTD to more than Rp15,000/USD in October. As market has priced in for 50bps rate hike in 2019, US treasury yield moves upward reaching 3.2% and bring capital back to US as USD index reached 96. Exhibit 9 showed how shifting FFR hike expectation affect Rupiah depreciation in 2017 – 2018. As Indonesia had higher CAD than region and also high proportion of foreign ownership in bonds and equity market, Rupiah became one of most severe victim in 2018 currency rout for Asia region (look at exhibit 8).
Bank Indonesia has raised rate for by 150bps so far to 5.75% to help Rupiah. However, our model denotes insignificant effect of rate hike to muffle Rupiah depreciation, especially in short term. Rate hike may push bond yield higher, making Indonesia’s yield higher than India (see exhibit 10) and more attractive for foreign investors despite more severe currency rout In India than Indonesia. It succeeds to maintain Indonesia’s bonds on net foreign buy territory as of September 2018 but it failed to bring Rupiah appreciate. Our model revealed that CAD, USD index, UST 10 year yield and Indonesia 5 yr CDS had more significant impact to Rupiah than BI 7-day reverse repo rate. Focussing on reducing CAD will give more significant impact for Rupiah amidst heightened global volatility than just a rate hike.
In 2019, we prepared 2 scenarios for Rupiah and rate expectation. The main difference between these two scenarios are the FFR expectation where the base case we only expect 50 bps hike with no further FFR hike in following years and second scenario where we follow FOMC guidance’s of 75 bps hike in 2019 and 25 bps hike in 2020. We incorporate potential FFR hike in 2020 because investors should try to price in Fed’s policy in 2020 by the end of 2019. For your information, our Rupiah and rate forecast does not incorporate higher tension of trade war and potential crisis in Italy, Turkey and other emerging markets. Higher oil price is included our scenario as it will affect CAD in our model.
Exhibit 8: Asia Currencies returns YTD as of Oct 5
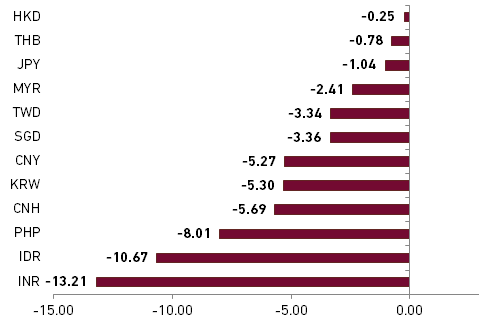
Source: Bloomberg
Exhibit 9: Rupiah and FFR Hike Expectation Shift
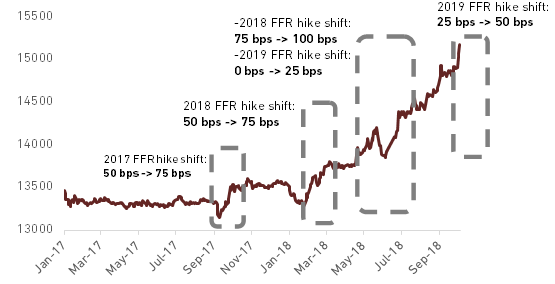
Source: Bloomberg
- Base case: USD/Rupiah at Rp 15,073 in 2019F average, YE rate at 6.75%
In our base case, we expect FFR will only be raised by 50 bps to 2.75% - 3.00% or lower than current FOMC projection. We believe that the effect of US-China of trade war is still not seen to employment segment. When unemployment rate and wage growth change from their current trend, Fed may consider cutting their FFR hike to only 50 bps or the high end of neutral rate (2.75% - 3.00%).
In this scenario, we expect Rupiah will have Rp 15,073 average in 2019. Rupiah will find pressure in the beginning of 2019 as investors try to weigh Fed’s projection of either 50 -75 bps FFR hike for 2019 in March meeting. Market pressure from FFR hike expectation will ease if Fed address only 50 bps FFR hike. Furthermore, slightly lower CAD as we expected in previous part enabling Rupiah to strengthen beyond Rp 15,000 level to reach Rp 14,777 in YE 2019. According this case, Bank Indonesia will raise rate by only 50 bps to match Fed’s pace in raising FFR.
- Alternative case: Rupiah at Rp15,706 in 2019F average, YE rate at 7.25%
Using the alternative scenario means higher pressure for Rupiah next year even though it will be still lower than 2018’s. Using FOMC meeting September’s guidance, FFR will be raised by 75 bps in 2019 and 25 bps in 2020. Market, who have priced in for 50 bps FFR hike since October 2018, will try to adjust for 50 bps more hike. We expect the first adjustment will happen in March and the second one in September. UST will have an uptrend to reach 3.65% in YE 2019 while we expect USD index to be slightly below 100. Indonesia’s 5 yr CDS will be around 126 in 2019 average, meaning the risk for Rupiah still high.
In this scenario, we expect USD/Rupiah to average Rp15,706 in 2019 with weaker YE closing at Rp16,077. Bank Indonesia will need to raise rate by 100 bps following the Rupiah movement.
Exhibit 10: Indonesia and India 10 year Bonds yield
Source: Bloomberg
Exhibit 11: Base and Alternative Case for Rupiah and Policy Rate in 2019
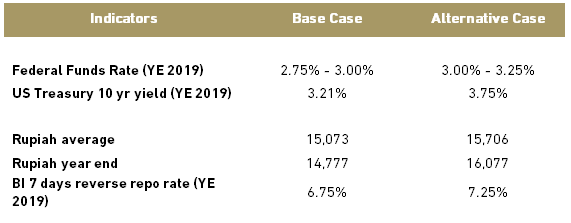
Source: Ciptadana estimates
Still populist fiscal to compensate Rupiah depreciation and higher rate
Government expenditure is set to increase by 10.0% from state budget 2018 realization to Rp 2,439 tn, with more allocation to social spending. Social assistance spending is set to grow 14.4% YoY to Rp 185.99 tn, much higher than 2018 growth (3.0%) in 2019 state budget draft. This allocation follows similar pattern with ex-president Susilo Bambang Yudhoyono (SBY), who also increased his social assistance budget by 27.5% when he campaigned during 2009 presidential election. Government also increased the allocation of regional transfer by 9.0% to Rp 832.3 tn, with village funds experienced the highest growth (21.7%) to Rp 73 tn. From 2018 experience, government program through village funds (especially cash for work) is seen effective to improve middle lower purchasing power. Meanwhile, government still put positive growth to infrastructure spending at 2.5% To Rp 421 tn even though the growth rate was lower than 2018 budget’s at 5.9% YoY.
- Confidence on government revenue post and lower deficit
Tax revenue improve in 2018, as of August 2018, tax revenue had reached Rp 799.42 tn or grew 16.5% YoY, reaching 56.14% of target. This figure is better than August 2018 performance when tax revenue only reached 53.4% of target. We expect 2018 tax revenue can reach Rp 1,352.8 tn (17.5% YoY) or 95% of target, favoured by automatic exchange of information (AEoI) agreement with Singapore that enabling Indonesia’s tax office to exchange Indonesian’s account data in Singapore. Combined with another boost in non-tax revenue due to higher oil price, we expect government can meet its revenue target of Rp 1,894,7 tn in FY 2018 with budget deficit around 2.1% of GDP.
Similar condition is expected to continue in 2019. AEoI can be the booster of tax revenue in 2019, making tax revenue can meet 95% - 100% of target next year. Non tax revenue is predicted not to exceed target as high as this year as government already set ICP assumption at USD 70/barrel, making tax revenue performance more vital than this year to meet revenue target. Government deficit should be around 1.8% of GDP in 2019 and any potential shortfall of government revenue will be managed by reducing energy subsidy and increasing fuel price as the election period only last in 1H19.
Exhibit 12: Government expenditure budget 2018 by sectors
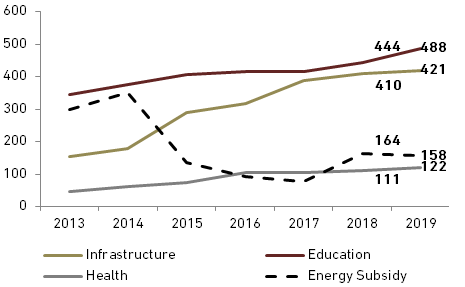
Source: MoF
Exhibit 13: Government’s budget for 2018
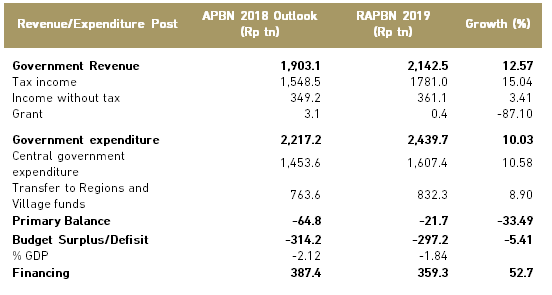
Source: MoF
Rupiah and higher rate to threaten GDP growth but populist fiscal will defend
Economic growth experienced modest pick up to around 5.16% YoY in 1H18 and we still expect 2018 growth to reach 5.26% in FY 2018. Investment still became the main driver of growth as it grew 6.89% YoY in 1H18. Consumption also denoted gradual recovery in 1H18 with 5.05% YoY growth after posting below 5% growth in 2017. However, the story must be different in 2019 as Rupiah depreciation and higher interest rate should drag down the growth, especially investment, to around 5.1%.
- Negative sentiment to investment
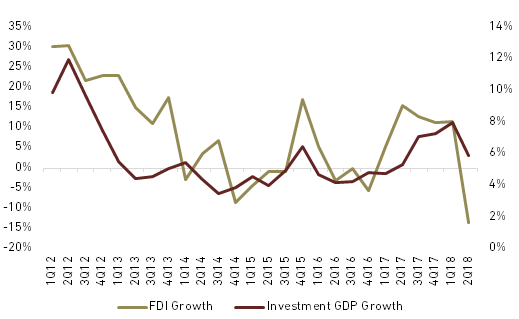
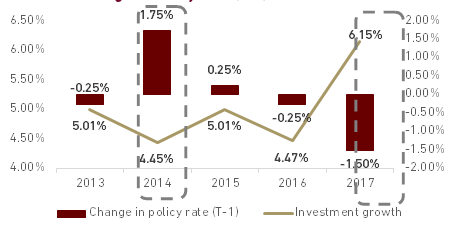
In 3Q17 – 1Q18, investment experienced significant growth above 7% as favored by lower interest rate, higher public infrastructure spending and stable Rupiah. However, the story should be different in starting 2H18 until 2019 as Rupiah depreciation and higher interest rate to challenge the resilience of investment. Even in 2Q18, foreign direct investment (FDI) already had double digit negative growth at -13.4% YoY, significantly lower than 1Q18 that still had 10.9% YoY growth, bringing investment growth in GDP to only 5.87% YoY. From exhibit 14, we learn that FDI growth in USD have strong correlation with investment growth in GDP. Continuous negative growth in FDI (in USD term) may restrain future investment growth and overall GDP. Furthermore, we believe that rate hike effect to investment growth will be more significant next year due to higher rate. Credit rate usually need 6-12 months (which means early 2019 in current case) to adapt higher policy rate. In 2014, investment growth experienced slow down due to significant higher rate in 2013 while 150 bps rate cut in 2016 give significant boost to 2017 investment growth (see exhibit 15).
Based on our view above, we predict investment growth in 2019 to be lower at 5.3% YoY from 6.5% in 2018.
- Consumption to become the champion next year
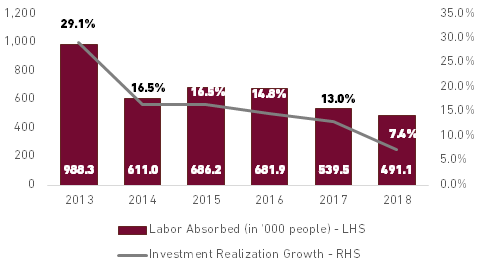
2Q18 became the major sign of awakening consumption growth as its growth reached 5.14% YoY after experiencing less than 5% growth since 4Q16. However, we do not think the higher purchasing power came from “organic growth” or better labor profile. According to investment board, labor absorption from investment in 1H18 was lower than 1H17. Although it is not reflected in higher unemployment rate, lower absorption reduce the chance to get full time job, as full time worker proportion decrease in February labor data. We view higher government social spending that played a significant role in raising consumption growth in 2Q18. In 1H18, realization of social assistance grew 74.8% YoY to Rp 45.1 tn in order to assist government social program like Program keluarga Harapan and non cash food aid.
Exhibit 14: Gross Fixed Capital Formation and FDI Correlation
Source: BKPM, CEIC
Exhibit 15: Change in Policy rate (T-1) and Investment Growth in GDP
Source: CEIC
Entering 2019, consumption growth will still depend on government spending as investment growth is predicted to be lower and restrain labor absorption. Government higher spending on social assistance and campaign spending will enable consumption remains robust. In state budget 2019 draft, social spending is set to grow 14.4% YoY to Rp 185.99 tn, much higher than 2018 growth (3.0%) and 2017 growth (4.6%). Moreover, it also raised civil servant salary by 5%, the first raise since 2015. These push should increase people purchasing power temporarily in the election year. We see cigarettes companies will be most benefited from higher government and non – institutional consumption in 2019.
Despite we see better consumption environment in 2019, the view also comes with some risks. First, there is a possibility of subsidized fuel price hike after the presidential election which we have elaborated on inflation section. Second, if Rupiah depreciation continues and firm decide to fully pass it to consumer, it may affect inflation and make people purchasing power, especially middle upper segment, lower. Third, potential political instability, especially if the election process and result is not as expected, will make people hold their spending in the political year.
Given those conditions, we expect that consumption will continue its uptrend growth in 2019. We expect 5.0% consumption growth in 2018 and a mild increase to 5.1% in 2019.
Exhibit 16: Investment Realization Growth and Labour Absorbed
Source: BKPM
Exhibit 17: Indonesia’s Macroeconomic Projection
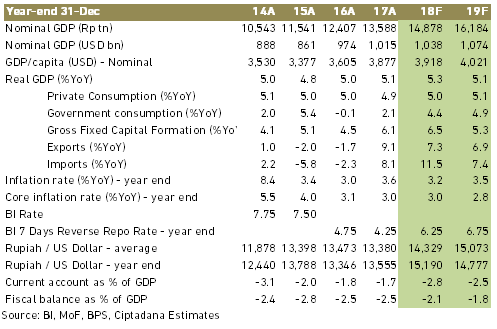
Source: BI, MoF, BPS, Ciptadana Estimates